Key points
- «Our addiction to fossil fuels is pushing humanity to the brink. We face a stark choice: Either we stop it — or it stops us,” UN Secretary General Antonio Gutierres said at the COP26 summit. While COP26 made some headway on climate commitments, the battle to constrain warming to 1.5C above pre-industrial levels by the end of the century is yet to be won, making the path to the Paris goal narrower than ever.
- The speed at which the world progresses on its journey towards a net zero carbon economy is dependent on policymakers, the targets and policies they set for reducing emissions, the willingness of companies to adapt, as well as the development and adoption of technologies that can assist in this change. Or at least buy some more time.
- Tracking this journey will give us an indication of which of the six climate scenarios developed by the Network for Greening the Financial System (NGFS) is the most likely to happen. To do so, we have developed a climate credibility tracker focusing on the three core elements of corporate action, policy action and technological change. By tracking these transition enablers, we will be able to assess the credibility of the climate targets and pledges that increasing numbers of countries and companies are adopting.
- Firstly, for assessing the credibility of corporate action, we introduce Fidelity’s proprietary Climate Rating covering 1,600 companies in our invested universe for now. The rating focuses on three core areas: net zero ambition, climate governance and capital allocation to the transition. We find that most companies are setting targets and taking measures to somewhat mitigate their impact on climate change, but are struggling to align their activities to a net zero path. The regional breakdown shows a wide disparity, with Europe and North America standing out, while those companies in Asia Pacific (ex Japan) and EMEA/LATAM are lagging.
- Secondly, in tracking technological change, we focus on game-changing technologies in the green transition that can potentially make optimistic climate scenarios more realistic. By monitoring the stage of development and diffusion of key technologies, their penetration rates and costs, we can identify tipping points which could lead to accelerated transition.
- Finally, for policy credibility, we have designed a framework that assesses the top five emitters’ actions on carbon pricing, political environment, policy incentives and international cooperation. On these metrics we also observe much disparity among regions, with the European Union scoring highly for its head start on developing carbon pricing mechanisms, while Russia and India receive a low credibility score for lack of political will and incentives to transition to a net zero carbon model.
- Our assessment of policies, corporate actions and technological progress to date leads us to a preliminary conclusion that a disorderly transition scenario is the most appropriate contender for our Capital Market Assumptions (CMA) base case, of the six climate scenarios in the NGFS framework. This envisions a world in which policy action on climate is delayed and/or is disruptive to economies and markets and is uneven across regions and sectors. This in turn results in increased physical and transition risks that translate into a potentially volatile environment for key macro indicators and a different set of CMAs to the one commonly used today.
- Our next step will be to link this analysis to our CMA machinery, which feeds into our strategic asset allocation (SAA) framework.
Introduction
Tackling the climate change crisis requires nothing short of a major transformation of the world’s economic model with particular focus on energy systems. The 26th UN Climate Change Conference of the Parties (COP26) may prove to be a pivotal moment in this transformation but the reaction to the outcomes has been mixed. While there were signs of tangible progress, the policy commitments and pledges made so far are still well short of what is required to put the world on the path to net zero by 2050 (Climate Action Tracker, November 2021).
Nobody knows for sure how climate change will play out in the 21st century, but we do have a variety of scenarios. Those provided by the Network for Greening the Financial System (NGFS) are used by major central banks to conduct climate stress tests and are likely to become the industry standard for assessing the effects of climate change on our economic and financial systems. In our first climate change white paper on this topic Planetary risk: Mapping climate pathways to macro and strategic asset allocation (July 2021) we laid out the conceptual and practical considerations of incorporating these scenarios into our climate aware capital market assumptions (CMAs). These will feed into the next generation of our strategic asset allocation (SAA) framework.
Not all scenarios are created equal, and some are more likely to occur than others. A strategic approach to asset allocation requires us to assess the credibility and likelihood of the various climate change scenarios and is a critical component of this CMA exercise. And so, in this paper, we lay out our thinking for structuring such an assessment, based on the roles of technology, policy and corporate actions, which are essential in facilitating a net zero transition.
We do know the world is rapidly approaching its 1.5C warming target relative to pre-industrial levels. Taking into account the uncertainty over the trajectory of national emissions policies, technological advances and the price of carbon, we conclude that the most likely climate scenario the world is facing today is that of a disorderly transition, whereby policies to cut greenhouse gas (GHG) emissions are delayed and/or diverge across countries and sectors.
Six scenarios to assess the future
The six NGFS scenarios are based on the physical and transition risk dimensions of the climate change challenge (Chart 1). Physical risks refer to the damage to the planet’s economic and life supporting ability as temperatures rise and transition risks encompass the implications for the economic and financial systems as policies and actions of the key stakeholders including corporates, investors and citizens change. The scenario set is also defined on the basis of whether changes to the economic system come through in an orderly or disorderly manner - determined by the timing and the degree of policy ambition and coordination - which can result in very different transition pathways, even if the ultimate temperature increase outcome is the same.
Chart 1: The NGFS scenario framework: six scenarios for climate pathways
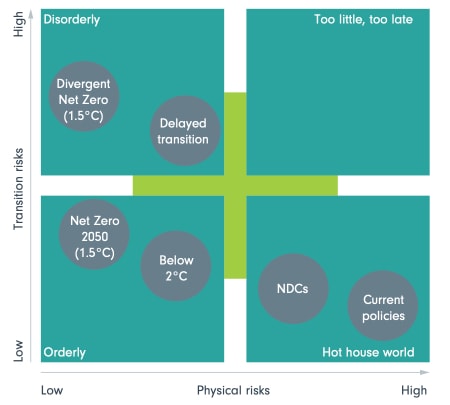
Source: Fidelity International, NGFS Climate Scenarios for central banks and supervisors (June 2021), November 2021.
Carbon price assumptions are key policy differentiators across the scenarios. Given the centrality of fossil fuels in the current global energy stack and the wider role of emissions in driving economic growth coming from our current economic model, trajectory of carbon prices plays a crucial role in assessing the medium-term impact on the macro variables across the various regions. Indeed, the impact on inflation is particularly pronounced in the orderly transition scenario throughout the 2020s given the assumption of immediate introduction of global carbon pricing, while the GDP impact is benign on aggregate.Under the delayed transition, however, the impact on inflation is postponed to the 2030s but still significant, while the resultant GDP cost is much higher. Understanding the different trajectories for key macro variables under the six scenarios is critical to building robust asset market return and risk projections.
Unpacking the climate change challenge and its relevance for base case assessment
Transforming the global energy system will not be easy. Chart 2 shows the emission contributions from various sources, revealing the breadth and scope of energy system transformation which will be needed to hit the net zero 2050 goal.
As we look to assess the credibility and in turn the likelihood of the various climate change scenarios, the linkages of the various factors which span the climate change challenge are important to lay out. As Chart 3 shows, the temperature increase above pre-industrial levels by 2100 is the ultimate metric in climate change science. The average global temperature is already estimated at 1.2C above pre-industrial levels, making the path to the Paris goal of 1.5C narrower as ever. Climate science has now unequivocally shown the link between the projected temperature pathways and human activity - here represented by GHG emissions in the second top level of the pyramid. As the challenge of climate change gets clarified and internationally agreed towards the goal of first reduction and then net elimination of emissions, the sources of emission contributions in the third level of the pyramid map the nature and scale of technological transformation needed to achieve the net zero goal.
Technology, in terms of the speed of its adoption and its effectiveness in reducing emissions, is deeply interlinked with policy, corporate action and associated behavioural changes which altogether can be defined as transition enablers in the foundational layer of the pyramid.
Chart 2: The energy sector is the biggest contributor to global GHG emissions
% share of global GHG emissions
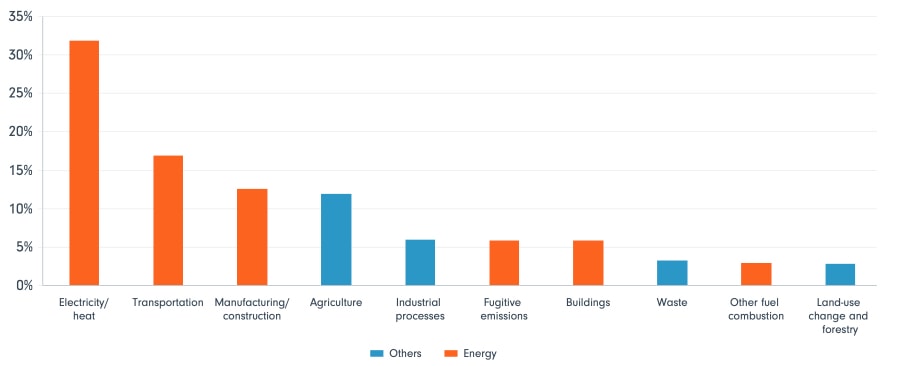
Source: Fidelity International, Climate Watch (2018), November 2021.
Chart 3: The climate transition pyramid - transition enablers are key for determining the climate change pathway
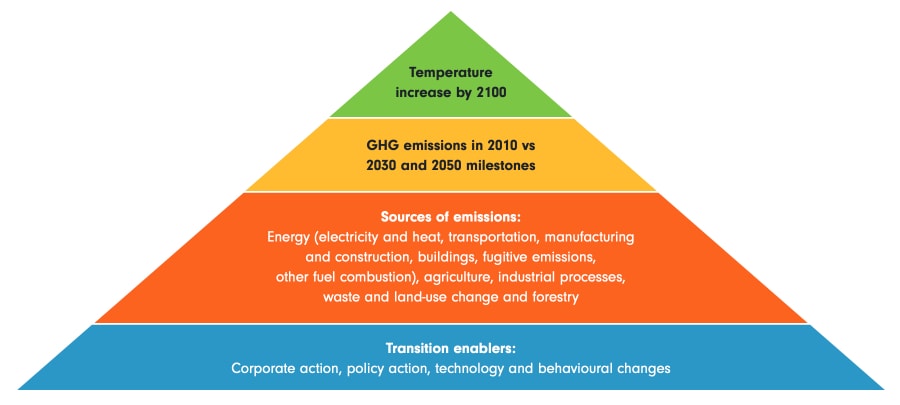
Source: Fidelity International, November 2021.
Carbon prices aim to connect the ecological cost of emissions to their economic cost. The carbon price trajectories, underpinning the different scenarios, which can only be driven by policy changes, are linked to the state of technology and its adoption. As technology improves, the world can afford a lower carbon price to achieve the net zero goal. On the flip side, higher carbon prices incentivise innovation and adoption of technological solutions needed to solve the climate change challenge. Ultimately, the transformation of our energy systems would need a planetary level technological shift and policies adopted by government are a key enabling force.
The regional differences, in terms of vulnerability to climate change and willingness or ability to provide and adopt solutions are equally important here. Chart 4 shows the projected physical damage to national economies under an RCP 8.5 scenario, which can be associated with the NGFS’s hot house world. The map paints a highly differentiated picture with countries like Brazil and India facing a near wipe-out of their economies, whilst China and US facing a sizeable physical damage shock. This differential vulnerability is even more extreme for a number of island countries which raised their concerns on this existential crisis at the recently concluded COP26 summit. When it comes to transition risks and burden sharing of global and regional policy changes, both the per capita emission rates (Chart 5) and historical emission trajectories have also become a serious point of contention as illustrated by the developments in Glasgow. While climate change is a global challenge, an appraisal of policy and technology developments in individual nation states is critical to a robust assessment of the credibility and likelihood of climate pathway base case.
Chart 4: Projected physical impact from climate change is highly variable across geographies, with southern hemisphere extremely vulnerable
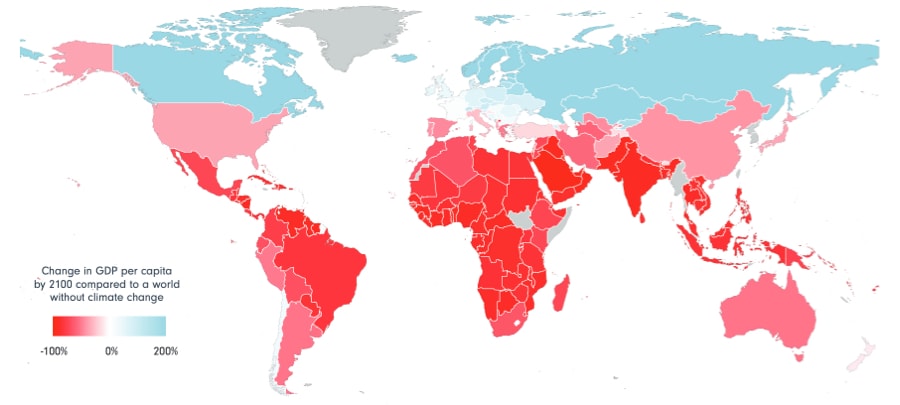
Source: Fidelity International, Burke, Hsiang and Miguel (2015), November 2021.
Note: The above shows the effects on per capita GDP of the Representative Concentration Pathway 8.5 (RCP 8.5), which is a GHG concentration trajectory adopted by the IPCC. RCP 8.5 is generally taken as the basis for worst-case climate change scenarios where emissions continue to rise throughout the 21st century. The effects are determined by the Burke, Hsiang, and Miguel (BHM) damage function, which quantifies the nonlinear effect of temperature change on economic production.
Chart 5: While China and India are the largest EM emitters in absolute terms, their per capita emissions are smaller than those of advanced economies
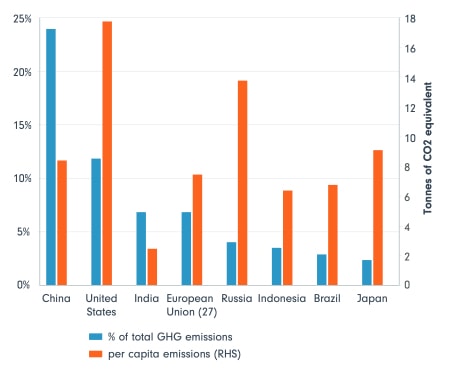
Source: Fidelity International, Climate Watch (2018), November 2021.
Tracking the credibility of climate transition pathways
Box 1: Key assumptions underlying NGFS scenarios
Tracking corporate action credibility using FIL’s proprietary Climate Ratings
Box 2: Assigning policy credibility ratings to top 5 emitters
Next steps - towards a new base case for CMAs
Important information
This material is for Institutional Investors and Investment Professionals only, and should not be distributed to the general public or be relied upon by private investors. This material is provided for information purposes only and is intended only for the person or entity to which it is sent. It must not be reproduced or circulated to any other party without prior permission of Fidelity. This material does not constitute a distribution, an offer or solicitation to engage the investment management services of Fidelity, or an offer to buy or sell or the solicitation of any offer to buy or sell any securities in any jurisdiction or country where such distribution or offer is not authorised or would be contrary to local laws or regulations. Fidelity makes no representations that the contents are appropriate for use in all locations or that the transactions or services discussed are available or appropriate for sale or use in all jurisdictions or countries or by all investors or counterparties. This communication is not directed at, and must not be acted on by persons inside the United States. All persons and entities accessing the information do so on their own initiative and are responsible for compliance with applicable local laws and regulations and should consult their professional advisers. This material may contain materials from third-parties which are supplied by companies that are not affiliated with any Fidelity entity (Third-Party Content). Fidelity has not been involved in the preparation, adoption or editing of such third-party materials and does not explicitly or implicitly endorse or approve such content. Fidelity International is not responsible for any errors or omissions relating to specific information provided by third parties. Fidelity International refers to the group of companies which form the global investment management organization that provides products and services in designated jurisdictions outside of North America. Fidelity, Fidelity International, the Fidelity International logo and F symbol are trademarks of FIL Limited. Fidelity only offers information on products and services and does not provide investment advice based on individual circumstances, other than when specifically stipulated by an appropriately authorised firm, in a formal communication with the client. Europe: Issued by FIL Pensions Management (authorised and regulated by the Financial Conduct Authority in UK), FIL (Luxembourg) S.A. (authorised and supervised by the CSSF, Commission de Surveillance du Secteur Financier), FIL Gestion (authorised and supervised by the AMF (Autorité des Marchés Financiers) N°GP03-004, 21 Avenue Kléber, 75016 Paris) and FIL Investment Switzerland AG. . In Hong Kong, this material is issued by FIL Investment Management (Hong Kong) Limited and it has not been reviewed by the Securities and Future Commission. FIL Investment Management (Singapore) Limited (Co. Reg. No: 199006300E) is the legal representative of Fidelity International in Singapore. This document / advertisement has not been reviewed by the Monetary Authority of Singapore. In Taiwan, Independently operated by Fidelity Securities Investment Trust Co. (Taiwan) Limited 11F, No.68, Zhongxiao East Road, Section 5, Taipei 110, Taiwan, R.O.C. Customer Service Number: 0800-00-9911 In Korea, this material is issued by FIL Asset Management (Korea) Limited. This material has not been reviewed by the Financial Supervisory Service, and is intended for the general information of institutional and professional investors only to which it is sent. Fidelity is authorised to manage or distribute private investment fund products on a private placement basis, or to provide investment advisory service to relevant securities and futures business institutions in the mainland China solely through its Wholly Foreign Owned Enterprise in China - FIL Investment Management (Shanghai) Company Limited.
Issued in Japan, this material is prepared by FIL Investments (Japan) Limited (hereafter called “FIJ”) based on reliable data, but FIJ is not held liable for its accuracy or completeness. Information in this material is good for the date and time of preparation, and is subject to change without prior notice depending on the market environments and other conditions. All rights concerning this material except quotations are held by FIJ, and should by no means be used or copied partially or wholly for any purpose without permission. This material aims at providing information for your reference only, but does not aim to recommend or solicit funds /securities.
GIM21UK1126